Most “Arduino music visualizer” projects you find online are a sound sensor wired to a handful of LEDs, blinking roughly in time with a bass drum. That works, and it is a fine first afternoon. But it is also the version that gets boring in about ten minutes, because it is not actually reacting to the music — it is reacting to how loud the room is.
This guide builds the version worth keeping: a strip of individually addressable LEDs that responds to real audio amplitude with sensible smoothing, plus a clear path to turning that loudness meter into an actual frequency spectrum. It is a genuinely good weekend project, and unlike a lot of beginner builds, you end up with something you will leave plugged in behind a monitor.
Amplitude versus frequency: pick your ambition before you buy parts
There are two fundamentally different things people mean by “music visualizer,” and they need different amounts of work from you.
The first is a VU meter — a bar of light whose length tracks how loud the sound currently is. One number in, one number out. This is easy: read the microphone’s analog voltage, figure out how far it is swinging, light up that fraction of the strip. Forty lines of code, no math library.
The second is a spectrum analyzer — separate bars for bass, mids, and treble, so a kick drum lights the left end and a hi-hat lights the right. That requires a Fast Fourier Transform (FFT), which is the algorithm that takes a chunk of audio samples over time and tells you how much energy sits at each frequency. The Arduino Uno can do this, but only just, and I would strongly suggest getting the VU meter working first. Every wiring and power problem you are going to hit shows up in the simple version, where they are far easier to diagnose.
The parts that actually matter
This post contains affiliate links. If you buy through them, this site earns a commission at no extra cost to you.
Start with the board. An Arduino Uno is the right call here, and not just out of habit — the Uno’s ATmega328P has a 10-bit analog-to-digital converter (meaning it reports voltages as a number from 0 to 1023) running at roughly 9,600 samples per second with a standard analogRead() call. That sample rate turns out to be the single number that governs how far this project can go, so it is worth knowing from the start. The Uno also gives you a beefy 5V rail and forgiving through-hole pins, both of which you want while you are still moving wires around.
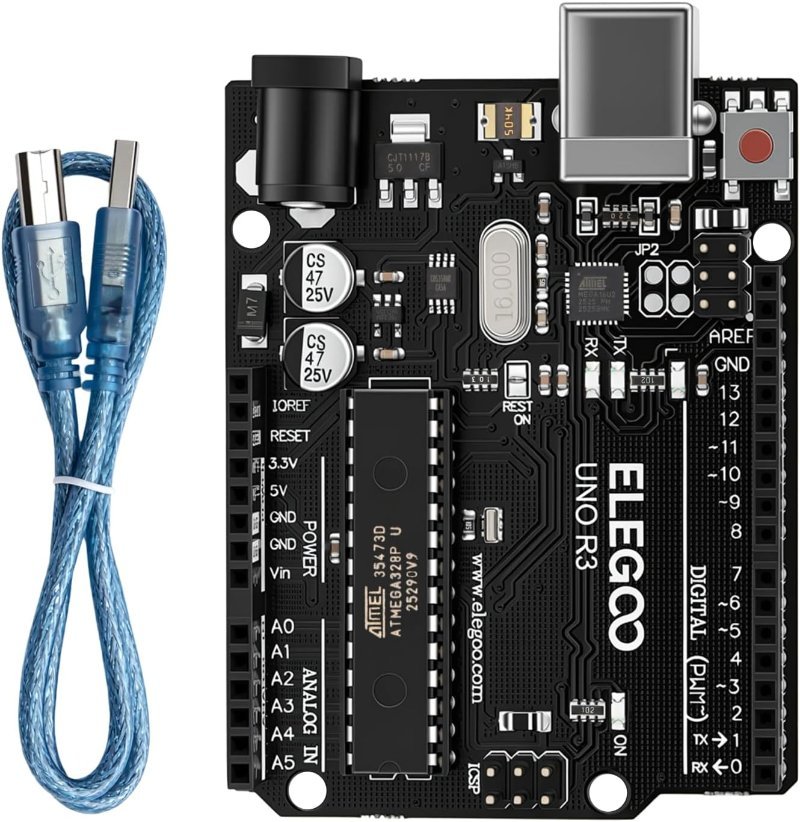
An ATmega328P Uno clone with the ATmega16U2 USB chip — the good one, not the flaky CH340 variety. 16 MHz, 14 digital I/O, and it takes the same sketches as a genuine Uno. If you already own an Uno, skip this and keep your money.
Check Price on Amazon →Next, the microphone, and this is where most builds go wrong. The cheap KY-038 sound sensor modules bundled into starter kits have a digital output with a sensitivity trimpot — they tell you “loud” or “not loud,” which is useless for a visualizer. You need a module that outputs a real analog waveform. The MAX9814 is the one to get, because it has automatic gain control: it continuously adjusts its own amplification so quiet passages still produce readable signal and loud ones do not clip flat. It runs on 2.7–5.5V, draws about 3 mA, covers 20 Hz to 20 kHz, and outputs roughly 2V peak-to-peak centered on a 1.25V bias.
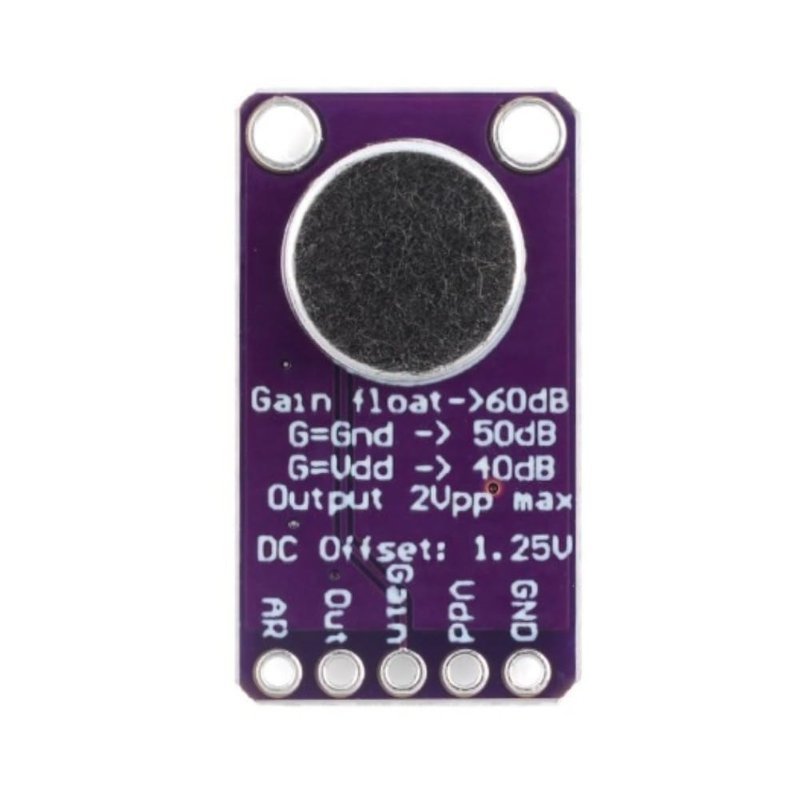
Electret mic plus an amplifier with selectable 40/50/60 dB automatic gain control. Its analog out goes straight into A0. This is the part that separates a visualizer that tracks music from one that just flickers at loud noises.
Check Price on Amazon →That 1.25V bias is important and trips people up: the microphone’s output sits at about a quarter of the way up the 0–5V range when silent, and swings above and below that resting point as sound pressure changes. So in your code, silence is not zero — it is a steady mid-scale reading. What you care about is the swing around that resting value, not the raw number.
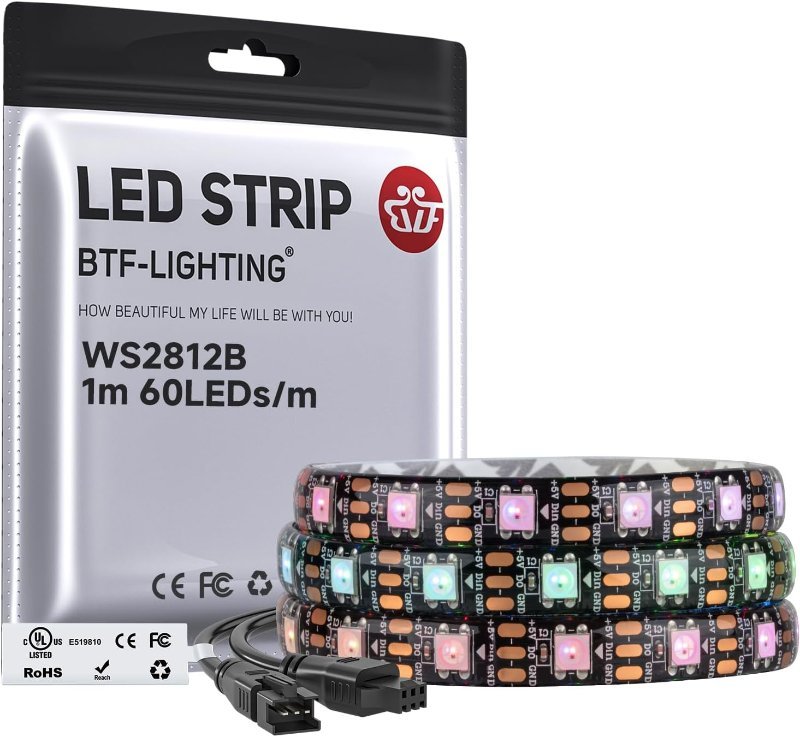
Finally, the lights. Use an addressable strip, not plain LEDs. On a WS2812B strip each LED has its own tiny controller chip built in, so all 60 of them share a single data wire and you set each pixel’s color independently. That is what makes a smooth, per-pixel bar of light possible from one Arduino pin. A one-metre 60-LED strip is the right density for a first build — dense enough to look continuous, short enough to power sanely.
5V, individually addressable, 60 pixels per metre, with JST connectors on both ends and a light silicone coating. Cuttable if you want a shorter bar. Note the 5V-only part — do not hand this a 12V supply.
Check Price on Amazon →(x, y) to an index yourself, which is a genuinely useful thing to have written once. Watch your SRAM though: 256 pixels needs 768 bytes of the Uno’s 2 KB just for the frame buffer.
Wiring, and the three things that will bite you
The connections themselves are short. The microphone gets 5V, ground, and its OUT pin to A0. The strip gets 5V, ground, and its data input (marked DIN, and pay attention to the arrows printed on the strip — data only flows one way) to a digital pin; pin 6 is conventional. Everything shares a common ground. If you are still shaky on how rows and rails connect, our breadboard wiring guide covers that ground.
Now the parts that are not obvious. First, power. A WS2812B pixel at full white draws roughly 60 mA — about 20 mA per color channel. Sixty of them, all white, all the way up, is about 3.6 amps. Your laptop’s USB port will supply 500 mA, which is roughly eight LEDs’ worth. In practice a visualizer is rarely all-white at full brightness, but “rarely” is not “never,” and the failure mode is not a polite dim — it is brownouts, random color glitches, and a resetting Arduino. Cap brightness in software with FastLED’s setBrightness() (start around 40 out of 255), and for anything beyond a short strip, feed the strip from its own 5V supply and just tie the grounds together. Our guide to voltage and current goes deeper on budgeting this.
Second, protect the strip. Standard practice, and worth doing: a 330–470 Ω resistor in series on the data line right at the strip’s input, and a 1000 µF capacitor across the strip’s 5V and ground. The resistor tames reflections on the data line; the capacitor absorbs the inrush when a lot of LEDs switch on at once. Both are cheap insurance against the two most common “my strip works for ten minutes then goes crazy” reports.
Third, logic levels. A 5V Uno driving a 5V strip is the easy case — everything matches. If you decide to build this on an ESP32 instead, its 3.3V data output is marginal for a 5V strip and sometimes needs a level shifter. That whole topic is worth understanding before you mix boards; we wrote it up in 5V vs. 3.3V logic levels.
The code: measuring the swing, not the value
The core of the simple visualizer is a short sampling loop. Over a fixed window — say 30 milliseconds — you repeatedly call analogRead(A0) and track the highest and lowest readings you saw. Subtract them and you have the peak-to-peak amplitude: a single number representing how hard the sound was pushing during that window. That is your loudness.
Then map that peak-to-peak value onto your pixel count and light that many LEDs. Two refinements make an enormous difference to how it looks. Smoothing: blend each new reading with the previous one (something like level = level * 0.7 + newLevel * 0.3) so the bar glides rather than strobes. Peak hold: keep a separate “highest recently” pixel that decays downward a step at a time, drawn in a contrasting color. That falling peak dot is most of what makes a VU meter look professional rather than homemade.
Use the FastLED library to drive the strip (Adafruit’s NeoPixel library does the same job). Worth knowing: WS2812B timing is strict enough that FastLED disables interrupts while it pushes data out. On a 60-pixel strip that is a short enough blackout that nothing cares, but it is the reason this kind of project and precise timekeeping do not mix well on an Uno.
Going from loudness to frequency
When you want actual bands, this is the constraint you are working inside. The Uno’s ADC gives you about 9,615 samples per second. The Nyquist limit — you can only resolve frequencies up to half your sample rate — caps you at roughly 4.8 kHz. That is not the full audible range, but it comfortably covers bass, vocals, and most of what makes music feel rhythmic, so it is plenty for a light display.
Feed a buffer of those samples into the arduinoFFT library. A 64-point FFT runs in about 2 milliseconds on an Uno, which leaves you room for a smooth 30-frames-per-second update. Sixty-four samples at 9,615 Hz gives you bins about 150 Hz wide — each output bin is a bucket covering a 150 Hz slice of the spectrum. Group those bins into however many bands you want to display, average the energy in each group, and drive a section of the strip from each.
One thing to expect: musical pitch is logarithmic but FFT bins are linear, so if you assign equal numbers of bins to each band, the bass band will look dead and the treble bands will look identical to each other. Weight your groupings — a few bins for the low band, many more for the high — and it will suddenly look right.
Is it worth building?
Yes, and specifically because it is a project where every layer teaches something you will reuse. The analog sampling loop is the same technique behind every sensor you will ever read quickly. The power arithmetic is the lesson that keeps your future robot from browning out. And the FFT step is a real signal-processing concept that you get to verify with your eyes instead of a textbook — clap once, watch which end of the strip jumps.
Start with the VU meter tonight. Get it smooth. Then add the FFT when the simple version stops being interesting, which it will, in about a week.