Most beginner Arduino debugging looks like this: the sketch compiles, the board does something wrong, and you start changing lines at random until it stops. That works roughly one time in five, and it teaches you nothing. The fix is to stop guessing what your code thinks and make it tell you — which is exactly what the two tools buried in the top-right corner of the Arduino IDE are for.
The Serial Monitor prints numbers. The Serial Plotter draws them. They sound like the same tool with different output, and that framing is why most people only ever learn the first one. They are actually good at opposite things, and knowing which to reach for is most of the skill.
The Serial Monitor: a window into a running program
Serial communication is just your board sending characters back up the USB cable one bit at a time. Before it can do that, you have to agree on a speed, and that is what the line in setup() does:
void setup() {
  Serial.begin(9600);
}

void loop() {
  Serial.println("Hello world!");
  delay(1000);
}
That 9600 is the baud rate — the maximum bits per second that can move across the connection. The number itself is arbitrary; what matters is that both ends use the same one. If your sketch says 9600 and the Serial Monitor’s dropdown says 115200, you do not get an error message. You get a window full of garbage characters, which is the single most common “my Serial Monitor is broken” problem and takes two seconds to fix once you know to look.
In Arduino IDE 2 the Serial Monitor is no longer a floating window. It opens as a tab at the bottom of the editor, in the same panel as the console output, and you launch it from the button at the top right corner of the IDE. One underrated consequence: because the monitor is tied to a sketch window rather than to the application, you can have two sketch windows open on two different boards and watch both at once. If you have ever debugged a transmitter and a receiver at the same time, you know why that matters. The official docs do note it gets heavy on your machine, so don’t open six.
The Monitor is the right tool whenever the thing you need to see is discrete: did this if branch run, what is this variable at the moment of the crash, is my sensor returning 0 or 1023 or something sensible in between. Sprinkling Serial.println() calls through a function to find where execution actually stops is crude, and it is also how working engineers find bugs.
The Serial Plotter: when the shape is the bug
Now take a different problem. Your sensor reading is noisy. You print it to the Monitor and you get a column of four-digit numbers scrolling past faster than you can read: 511, 509, 514, 508, 2, 512, 510. Did you catch the 2? Over thirty seconds of scrolling, you won’t. A single bad sample hiding in a stream of good ones is invisible as text and unmissable as a line on a graph.
That is what the Serial Plotter is for. It reads the same serial stream, but any numeric value it finds becomes a point on a scrolling chart. It needs at least one numeric variable — an int or a float — and it opens from its own button in the top right of the IDE window. Upload first, then open it; opening the plotter mid-upload is a reliable way to see nothing.
Arduino’s own example sketch for the tool is worth copying verbatim, because it demonstrates the one trick that makes plots readable — a second, constant trace to measure against:
int potentiometer;
int static_variable = 500;

void setup() {
  Serial.begin(9600);
}

void loop() {
  potentiometer = analogRead(A1);

  Serial.print("Variable_1:");
  Serial.print(potentiometer);
  Serial.print(",");
  Serial.print("Variable_2:");
  Serial.println(static_variable);
}
analogRead() on an Uno returns a whole number from 0 to 1023, because the board’s analog-to-digital converter is 10-bit — it chops the voltage range into 1,024 steps. (If that distinction is new, our guide to digital vs. analog pins covers it properly.) The flat 500 line gives your eye a reference, so a wobble you’d never notice in isolation becomes obviously a wobble.
This post contains affiliate links. If you buy through them, this site earns a commission at no extra cost to you.
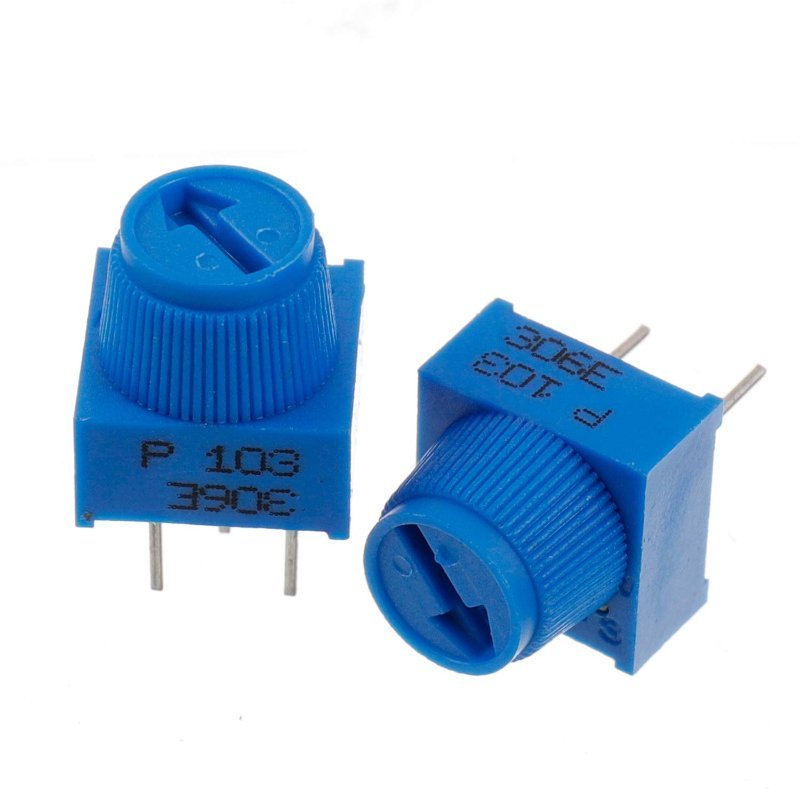
You can run that sketch with random() instead and watch noise, but it’s a waste of the tool. The reason Arduino lists a potentiometer as the one optional part for this tutorial is that a knob closes the loop between your hand and the graph: you turn, the line moves, and the relationship between physical input and digital value stops being abstract. A ten-pack of breadboard trim pots costs about what a sandwich does and will outlast several projects.
Three legs, breadboard-friendly spacing, and a knob big enough to turn with your fingers instead of a screwdriver — which matters more than it sounds when you’re watching a graph respond. 10K is the default value for a reason: wired across 5V and ground it gives you the full 0–1023 analogRead sweep without drawing meaningful current. Buy the multipack; you will lose one.
Check Price on Amazon →Light:. Now wave your hand over the board. The pot trace is smooth because you control it; the light trace jitters because real-world sensors do. Seeing both on the same axes in the same second is the fastest way to internalize the difference between a clean input and a noisy one — and it’s the same picture you’ll use later to judge whether a smoothing filter actually helped.
The formatting rules that decide whether anything shows up
The Plotter is picky in a few specific ways, and almost every “why is my plotter empty” post comes down to one of them.
Each reading has to end in a line break. The Plotter recognizes only CRLF (\r\n) and LF (\n) as line breaks. Serial.println() adds one for you, which is why the examples above end on a println and use print for everything before it. If you build a line entirely out of print calls, you have to finish it with Serial.print("\n") yourself or the graph never advances.
Multiple values on one line need a delimiter. A comma, a tab, or a space all work. Pick one and stay consistent.
Labels are a colon, and they’re worth the keystrokes. Prefix a value with a name and a colon — Light:, x:, Variable_1: — and that name becomes the trace’s label in the legend. Leave the labels off and the IDE generates default ones, which is fine with one trace and useless with four. Labeled traces also get individual checkboxes, so you can hide the one with the huge range that’s flattening everything else.
There’s a subtle trap in the protocol worth knowing about. You’re allowed to send labels just once, as a header in setup(), and then stream bare numbers afterward. Arduino’s own protocol notes warn against this on boards with a USB-to-UART converter chip — the board starts running and sends that header the instant it’s powered, long before you click the Plotter button, so the labels are gone forever and you’re left with unnamed traces. Re-send the labels with every reading. The extra bytes cost you nothing you’ll notice.
One more, which is really a consequence of the first three: the Plotter cannot show you text. A stray Serial.println("entering loop"); left in from an earlier debugging session will sit in the stream and quietly corrupt your graph. The Monitor and the Plotter read the same port, so a sketch instrumented for one is usually wrong for the other. Decide which tool you’re using before you write the print statements.
Where the Plotter really earns its place: several axes at once
One trace is a nice demo. The tool becomes genuinely indispensable when you have three numbers that only make sense in relation to each other, and the cheapest way to get that situation on your desk is a six-axis motion sensor. An MPU-6050 breakout gives you three acceleration values and three rotation values, all updating continuously, all meaningless as scrolling text and immediately legible as three lines on a chart.
The module talks over I2C — a two-wire bus where a clock line (SCL) and a data line (SDA) are shared by every device, each answering to its own address. The MPU-6050 defaults to address 0x68; the AD0 pin on the breakout has a 4.7K pull-down resistor, so leaving it unconnected selects 0x68, and tying it to 3.3V moves it to 0x69 so you can run two on one bus. If a scanner sketch comes back with nothing, our I2C troubleshooting guide is the place to start.
Wiring is reassuringly dull. The GY-521 board carries its own 3.3V regulator, so VCC goes to the Uno’s 5V pin even though the chip itself runs at 3.3V, and because I2C is open-drain with pull-ups to 3.3V, level translation generally isn’t considered necessary with a 5V microcontroller. That’s one of the few cases where you can ignore the usual warnings — worth reading our explainer on 5V vs. 3.3V logic levels to understand why it’s an exception rather than the rule.
#include <Wire.h>
const int MPU = 0x68;

void setup() {
  Serial.begin(9600);
  Wire.begin();
  Wire.beginTransmission(MPU);
  Wire.write(0x6B);        // PWR_MGMT_1 register
  Wire.write(0);           // clear the sleep bit
  Wire.endTransmission(true);
}

void loop() {
  Wire.beginTransmission(MPU);
  Wire.write(0x3B);        // ACCEL_XOUT_H
  Wire.endTransmission(false);
  Wire.requestFrom(MPU, 6, true);

  int16_t ax = Wire.read() << 8 | Wire.read();
  int16_t ay = Wire.read() << 8 | Wire.read();
  int16_t az = Wire.read() << 8 | Wire.read();

  Serial.print("aX:");  Serial.print(ax);
  Serial.print(",aY:"); Serial.print(ay);
  Serial.print(",aZ:"); Serial.println(az);
  delay(20);
}
Each axis arrives as a signed 16-bit value from the sensor’s own ADCs, which is why the numbers look enormous — they’re raw counts across whichever full-scale range is selected, not g-forces. The accelerometer offers ±2g, ±4g, ±8g and ±16g; the gyroscope offers ±250, ±500, ±1000 and ±2000 degrees per second. For plotting purposes the raw counts are fine. Tilt the board and watch which line crosses which.
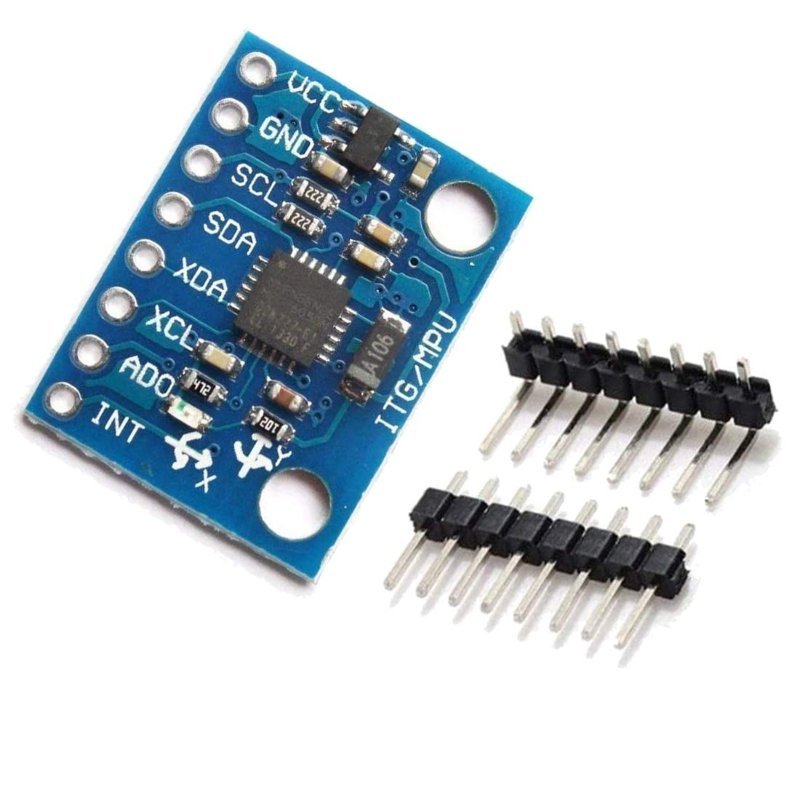
The default cheap IMU, and deservedly so. Pre-soldered headers, 16-bit output on all six axes, one 3.3V regulator on board so it runs straight off the Uno’s 5V rail, and enough library support that you can be plotting inside ten minutes. It’s also the sensor that makes the Plotter’s multi-trace labeling feel necessary rather than decorative.
Check Price on Amazon →A workflow that actually finds bugs
Here’s the division of labor worth committing to memory. Reach for the Monitor when you need to know whether — whether a function ran, whether a value is what you assumed, whether the board got past line 40. Reach for the Plotter when you need to know how — how fast something settles, how much it drifts, how a filter changed the shape, whether that one bad reading is a glitch or a pattern.
Two habits make both tools dramatically more useful. First, print a reference line, as that static_variable = 500 does — an expected value, a threshold, a target. A single trace with nothing to compare to tells you very little. Second, watch your delay() calls. A one-second delay in loop() means one data point per second, which turns any real signal into a staircase. For plotting, 10 to 50 milliseconds is the useful range.
None of this requires buying anything beyond a board you already own and a knob that costs less than a coffee. It does require deciding, before you start changing code, that you are going to find out what’s happening instead of guessing. That’s the actual skill. The two buttons in the corner are just how you practice it.